Level of Service (LOS) Table Generator
Level of Service (LOS) Table Generator Tool allows you to quickly and accurately create Level of Service tables and eliminates the need for manual data processing.
How it Works:
The tool processes output from Synchro traffic modeling software in the form of text files (.txt). Using advanced algorithms, it extracts relevant data and presents the results in customizable tables.
Tool Features
Below is a detailed list of features and how you can utilize them to generate LOS tables tailored to your needs.
The tool’s features are categorized as follows:
Calculation Methodology
In this tab, you can select the calculation methodology for generating LOS tables. Syndata supports the following methodologies:
-
HCM 6th Edition
-
HCM 7th Edition
-
HCM 2010
-
Lane Volume Timing
-
HCM 2000
-
Queues Calculation Methodology
The methodology selection is divided into Signalized Intersections and Unsignalized Intersections, allowing you to use different methods for different intersection control types.
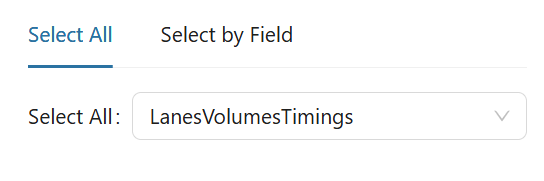
- Use the Select All tab to apply the same methodology across all fields.
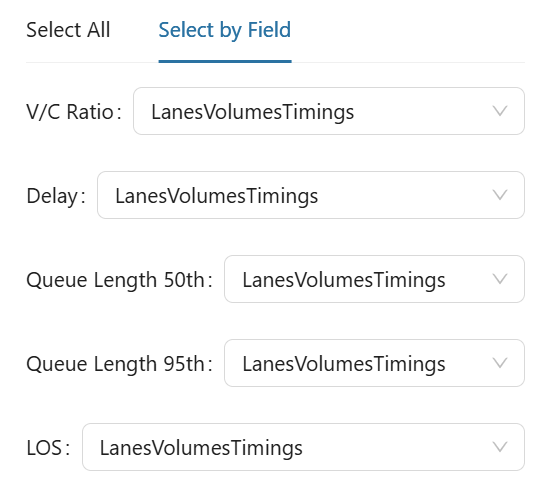
- Use the Select By Field tab to customize methodologies for specific fields.
- Use the Intersection Override feature to override the default calculation methodology for specific columns at a given intersection.
By default, the parser applies a single methodology to all intersections. However, this override lets you handle exceptions where certain intersections require a different methodology.
When you add an intersection override, a cascading menu appears that allows you to: - Select the custom methodology you want to apply. - Choose the specific columns at the selected intersection where the override should take effect.
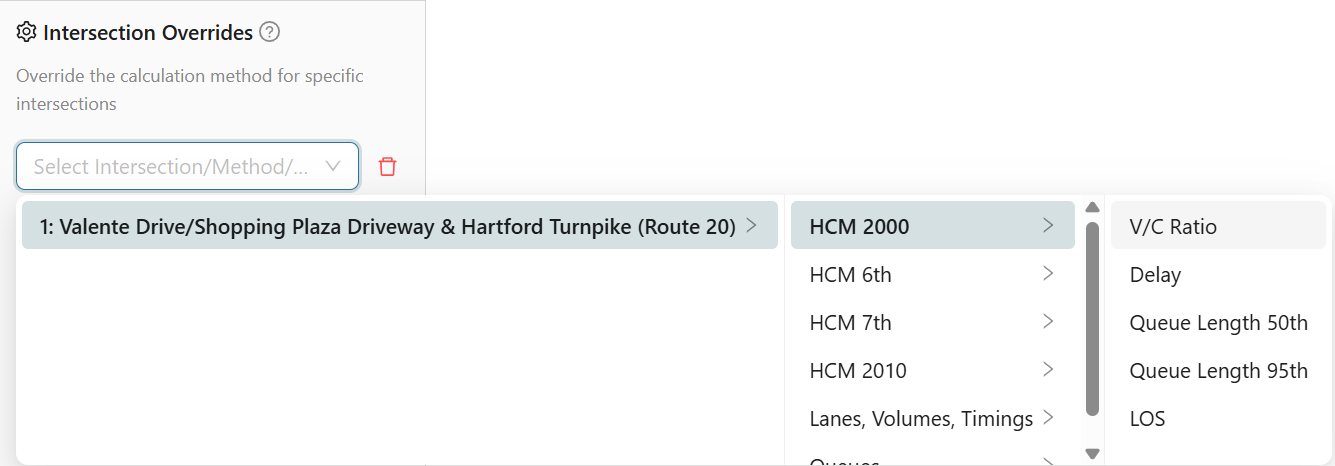
This feature ensures flexibility for handling special cases that deviate from the standard configuration.
Formatting
In this tab, LOS tables are highly customizable and allow you to create tables that suit your reporting needs. Below is an explanation of all the different customization options available to you:
-
Label Column Name
Customize the name of the label column to match the desired display in your table. -
Empty Rows
Choose how empty rows should be displayed. The three available options are:- Hide all empty rows
- Fill rows with zero (
0) - N/A fills rows with
N/A
-
Show LOS Color
Apply a color gradient from green for LOS A to red for LOS F for visual clarity. -
Show Special Characters
Remove special characters such as#,m, and~from the displayed data. -
Precision
Choose the number of significant figures or decimal places you want to display after the decimal point. -
Storage Length Formatting
Customize the format of storage length values in the table, including the units of measurement and decimal precision. -
Direction Order
Rearrange the order of directional approaches (e.g., Northbound, Southbound, etc.) for each intersection. -
Approach Order
Rearrange the order of the approaches for each intersection to match the desired sequence in your table. -
Right-Click and Top Row Formatting
The table allows for the following formatting options:- Reorder columns by dragging them within the top row.
- Sort columns by clicking on the column header to arrange the data in ascending or descending order.
- Right-click columns to hide or unhide them.
Rows
The Rows tab lets you customize the data displayed in your LOS table, including advanced grouping and pivoting features using built-in pivot tables.
Pivot Conditions
Enabling Pivot Conditions allows you to group your LOS table by conditions or scenarios, creating a more dynamic and comparative view.
Data Grouping Categories
Row data is organized into three levels:
1. Overall Intersection Level Data
- Displays all data from your uploaded file linked to the entire intersection.
- You can:
- Choose whether to show this row.
- Apply various formatting options.
- Set the position (top or bottom) for each intersection.
Pivot Option: Toggle this setting to display the row data on the right side instead of across the top.
2. Approach Level Data
- Shows data related to specific approaches within the intersection.
- Customizable formatting options are available.
3. Lane Level Data
- Displays all lane-specific data from your uploaded file.
- The lane label can be formatted in eight different styles based on user preference.
Lane Label Formatting Options
| Format Style | Description |
|---|---|
NBT |
Shows only the lane name from Synchro (e.g., Northbound Thru). |
NB-LTR |
Shows allowed movements from shared lanes (e.g., Left/Thru/Right). |
NB-L/T/R |
Same as above but with slashes. |
Northbound LTR |
Same as above but with fully spelled out direction. |
NB-LTTR |
Adds lane counts with allowed movements (e.g., NB-L/T/T/R). |
NB-L/T/T/R |
Same as above with slashes. |
Northbound LTTR |
Fully spelled out direction and lane movement configuration. |
Direction-only |
If the movement is just right, thru, or left — it will be spelled out. |
- You also have multiple formatting and positioning options for these rows, just like with the other data levels.
💡 Tip:
Explore different combinations to find the most meaningful layout for your analysis. Formatting and visibility preferences can be adjusted per intersection, approach, or lane.
Columns
Under the Columns tab, you’ll find a variety of columns that you can choose to show or hide based on your reporting needs.
Use this section to tailor your LOS table display to only the most relevant data for your analysis or presentation. Toggle visibility for each column individually to create a cleaner, more focused output.
Cells
Double-clicking a cell or right-clicking it allows you to override the value in that particular cell. Once the value has been overridden, the text in the cell will turn red. You can right-click the cell again to revert the value back to the original.
In the storage lane column, cells are edited by double-clicking the cell and adding a slash (/) to separate the length inputs for different lanes.
Calculation Methodology
This section details how our algorithm extracts data from uploaded text files for each supported methodology.
Syndata supports HCM 6th, HCM 2010, Lane Volume Timing, HCM 2000, and Queues methodologies at both lane level and approach level.
Lane level calculations
Lane Volume Timing & Queues
Level of Service is obtained from the text line labeled LOS
V/C ratio is obtained from the text line labeled V/C Ratio
Delay is obtained from the text line labeled Control Delay or Total Delay or Queue Delay depending on the delay type selected during project setup,the delay type can be changed in the project setting page
50th and 95th percentile queues are obtained from text line labeled Queue Length 50th (ft) & Queue Length 95th (ft)

HCM 6th , 7th & HCM 2010
Signalized Intersections
Level of Service is obtained from the text line labeled LnGrp LOS

V/C ratio is obtained from the text line labeled V/C Ratio (X)

Delay is obtained from the text line labeled LnGrp Delay(d),s/veh

Unsignalized Intersections
Data is extracted from the Minor Lane/Major Movement section, capturing V/C ratio, delay, and 95th percentile queue length.
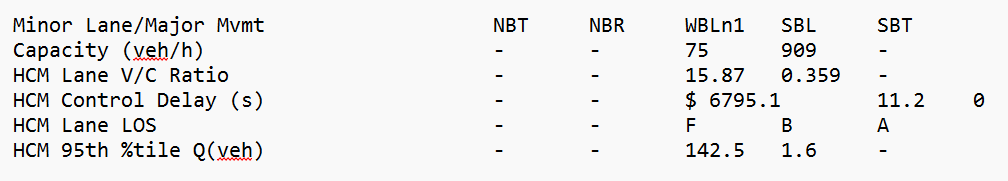
Queue Lengths are converted from Vehicle (veh) to Feet (ft) based on the length of the car user supply while setting up the project. Users can also change the length of the car by updating the value in the project setttings page.
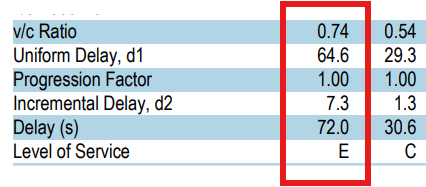
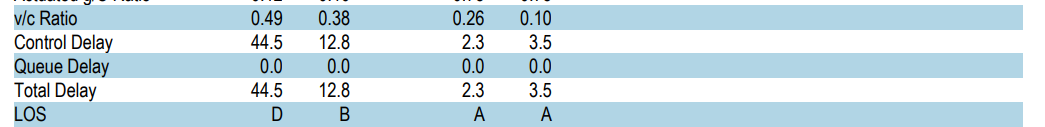
HCM 2000
Signalized Intersections
Level of Service is obtained from the text line labeled Level of Service

V/C ratio is obtained from the text line labeled v/c Ratio

Delay is obtained from the text line labeled Delay (s)

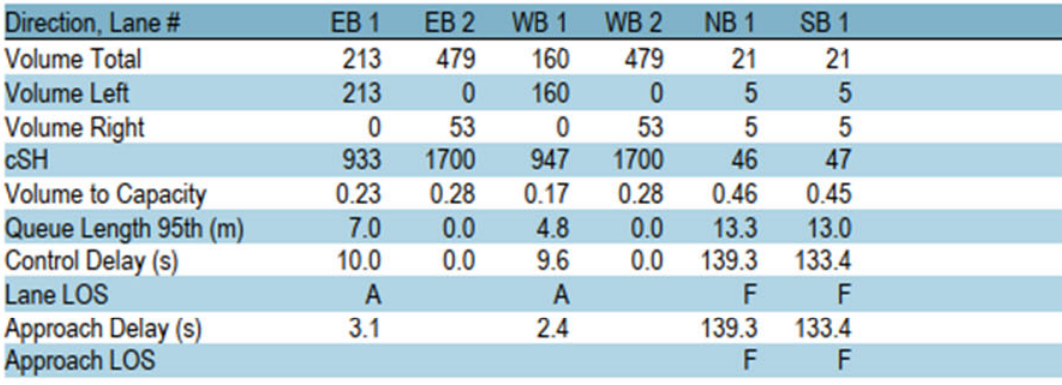
Unsignalized Intersections
Data is extracted from the Direction, Lane # section of the .txt file
Approach level calculation
Lane Volume Timing & Queues
Level of Service and Delay is obtained from the text lines labeled Approach Delay & Approach LOS

HCM 6th , 7th & HCM 2010
Signalized Intersections
Level of Service and Delay is obtained from the text lines labeled Approach Delay, s/veh & Approach LOS

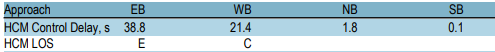
Unsignalized Intersections
Level of Service and Delay is obtained from the text lines labeled HCM Control Delay, s & HCM LOS
HCM 2000
Signalized & Unsignalized Intersections
Level of Service is obtained from the text lines labeled Approach LOS

Delay is obtained from the text lines labeled Approach Delay (s)

Intersection Summary Calculation
Lane Volume Timing & Queues
Level of Service and v/c ratio is obtained from the text lines labeled Intersection LOS & Maximum v/c Ratio respectively

HCM 6th , 7th & HCM 2010
Signalized Intersections
Level of Service and Delay is obtained from the text lines labeled HCM 6th/7th/2010 Ctrl Delay & HCM 6th/7th/2010 LOS

Unsignalized Intersections
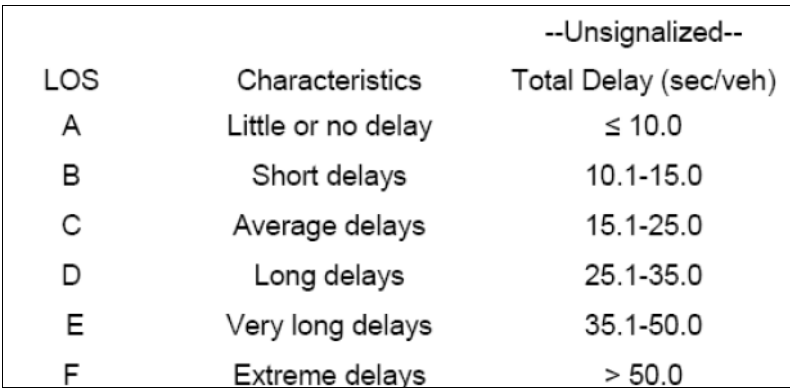
Intersection delay is obtained from the text lines labeled Int Delay, s/veh

intersection LOS is calculated using the Intersection Delay and the conversion table provided below
HCM 2000
Signalized Intersections
Level of Service, v/c ratio and Delay is obtained from the text lines labeled HCM 2000 Level of service, Volume to Capacity Ratio & HCM 2000 Control Delay respectively

Unsignalized Intersections
Level of Service and Delay is obtained from the text lines labeled ICU Level of Service & Average delay respectively
Shared Lane Calculation Exception
Shared lanes are treated differently from dedicated lanes because they accommodate multiple movements but require a single output for reporting.
As is standard practice in the industry, delay is used to determine the correct input when selecting between multiple movements. The algorithm follows a structured process to evaluate and display the appropriate values in the final table.
When processing a shared lane, the algorithm identifies the movement with the highest delay and uses its corresponding values for the volume-to-capacity (v/c) ratio, queue lengths, control delay, and level of service (LOS).
The two columns below display results for the left-turn and through movements of a shared left/through lane. The first column represents the left-turn movement, and the second column represents the through movement. The report will display the values associated with the left-turn movement since it has the higher delay.